अपडेट
 भाकपा(माले) का परिचय
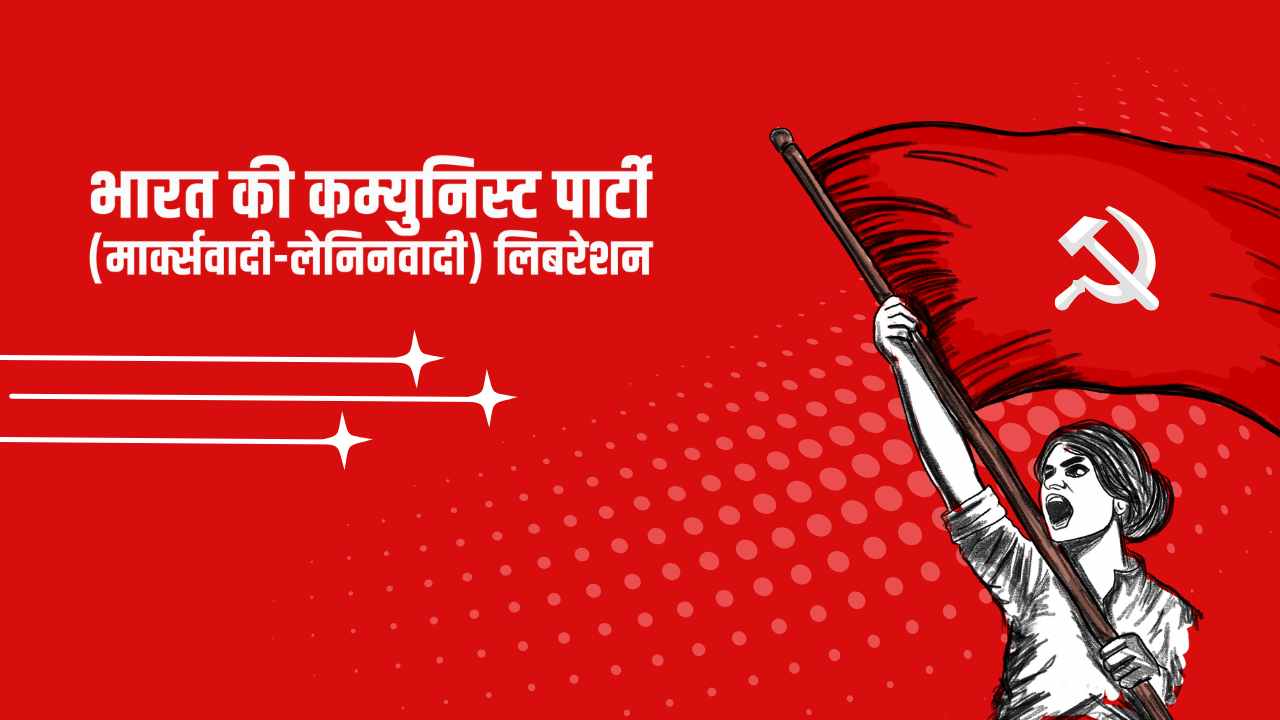
भारत की कम्युनिस्ट पार्टी (मार्क्सवादी-लेनिनवादी) लिबरेशन मई 1967 में महान नक्सलबाड़ी जनविद्रोह में जन्मी एक भारतीय कम्युनिस्ट पार्टी है. नक्सलबाड़ी जन उभार भारत की जनता के सबसे दमित उत्पीड़ित हिस्सों को भारतीय राजनीति के पटल पर खड़ा करके उन्हें भारतीय क्रांति की चालक शक्ति के रूप में सामने लाया. इसी प्रक्रिया में इसने पुन्नप्रा-वायलार और तेलंगाना के कम्युनिस्ट नेतृत्व वाले ऐतिहासिक किसान आन्दोलनों के साथ निरंतरता को भी स्थापित किया. भारतीय परिस्थितियों में मार्क्सवाद-लेनिनवाद के सिद्धांतों को लागू करने की प्रतिबद्धता के साथ पार्टी की स्थापना लेनिन के जन्म दिवस 22 अप्रैल को 1969 में की गई. भारतीय कम्युनिस्ट आन्दोलन में संशोधनवाद और अराजकतावादी धाराओं के खिलाफ संघर्ष चलाते हुये...आगे और...
-

हमारे सांसद एवं विधायक
-

संगठन
समकालीन लोकयुद्ध